HOW DOES HOME RUN FORECAST WORK?
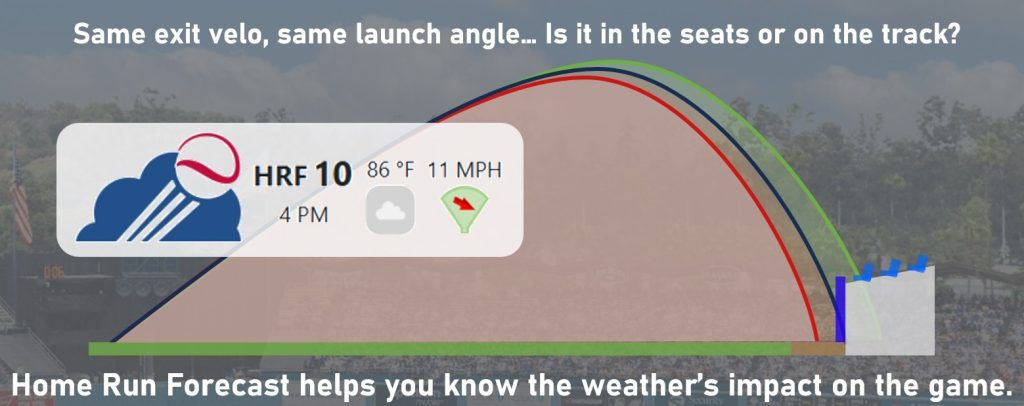
It's really about the weather. Weather conditions impact baseball flight through the air. The same batted ball goes a different distance depending on weather. The difference between a 1 and a 10 HRF index value can be more than 20% for the distance traveled. On a good day a ball that normally goes 350 feet could fly 385, and the same ball on a bad day might go 315. Read on to see how this impacts total runs and home runs in real games played in different conditions.
2024 FIRST HALF RESULTS
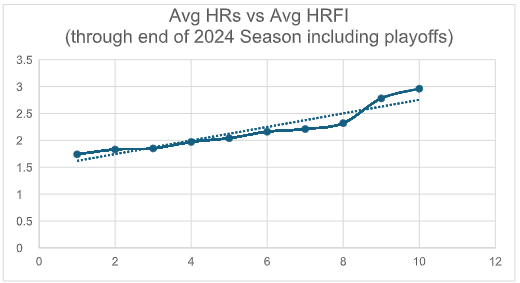
HRFI versus Total Home Runs
Total home runs in a game and the HRFI are strongly correlated in the 2024, as we have seen in the past several seasons. Remember, for the same ball in different conditions, it can travel 20% further with an HRFI of 10 versus and HRFI of 1. That translates well through the 2024 season so far.
Comparing HRFI to Total Home Runs per game:
- HRFI 1's < 2.5 HRs 70% of the time
- HRFI 10's > 2.5 HRs 59% of the time
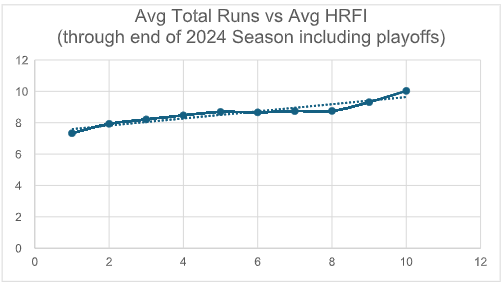
Total Runs
HRFI 9's and 10's are:
- > 7.5 Total runs 61% of the time
- > 8.5 Total runs 53% of the time
- > 9.5 Total runs 41% of the time
Games in which the Average HRFI was 9 or 10, the Over on 7.5 total runs was successful 61% of the time, 53% successful on 8.5 total runs, 41% successful on 9.5 total runs
2024 (to date) versus 2023
2024 | 2023 |
Avg HRFI = 6.05 | Avg HRFI = 5.42 |
Avg Runs = 8.78 | Avg Runs = 9.19 |
Avg HRs = 2.19 | Avg HRs = 2.31 |
Avg Actual O/U = 8.38 | Avg Actual O/U = 8.72 |
APRIL 2024 RESULTS
April is over, and the HRF index proved useful again in the spring weather. When the HRF is 1 or 2, the conditions are poor relative to average for carrying the ball a long distance, and this impacts scoring. For games in April with an HRFI of a 1, the total runs scored comes in less than the O/U 68.5% of the time. When the HRFI was 1 or 2, these were less than the O/U 63.5% of the time. Total Home Runs hit in games with an HRF index of 1 were less than 2 59.2% of the time, and less than 2 total Home Runs 60.0% of the time when looking at HRF 1's and 2's.
These results utilize the O/U values from the ESPN BET sports book, other results may vary. As always, use this data at your discretion.
HOME RUN FORECAST INDEX VERSUS TOTAL RUNS AND HOME RUNS
The 2024 season well under way, and you may be wondering how the HRFI correlates with the number of runs and home runs hit for games played in open air conditions. Below our 2023 results describe the expected relationship between HRFI and Total Runs or HRs.
You can still view our 2022 results if you Click Here.
2023 RESULTS BY CATEGORY
Runs | 8.6 | 9.2 | 10.3 |
HRs | 1.9 | 2.4 | 2.9 |
If we designate categories for the HRF Index by using values of 1 and 2 for LOW; 3-8 for MEDIUM, and 9 and 10 for HIGH, we can see a clear upward trend in the average number of runs scored and home runs as we go from LOW-to-MEDIUM-to-HIGH.
Games in 2023 averaged of 2.4 home runs and 9.2 runs. Those totals vary significantly depending on the HRF Index. When the Index is LOW, 2 or fewer home runs (the under) are hit in 71% of games. When the Index is HIGH, 3 or more home runs (the over) are hit 65% of the time. Games with a HIGH average HRF index of 9 or 10 recorded average total runs of 10.3, and 2.9 homers per game.
We also see an interesting jump in the numbers when we separate out the 9’s and 10’s from the rest of the results. When the index is HIGH, at a value of 9 to 10, the average number of runs is more than 1 run more than average runs per game compared to when the Index is at 8 or less.
2023 RESULTS BY HRFI VALUE
The table below breaks down the number of games that had a specific Index average, as well as the number of runs and home runs averaged at that level. At the high end, games with a 9 and 10 Index averaged 10.3 runs a game. The 2023 season had 216 games with a 9 or 10 index value, scoring more than 1 run over the average number of runs per game across all games.
Alternatively, you can see that there have been 98 games with an average Index of 1 or 2. This is not surprising given the cooler temps we saw in the first few months of the season. Those 156 games averaged 8.6 runs and less than 2 home runs, on average total runs scored are 8 or fewer runs and 1 or fewer HRs when the Index value is 1 or 2.
1 | 101 | 8.7 | 1.9 |
2 | 56 | 8.4 | 1.9 |
3 | 189 | 8.9 | 2.2 |
4 | 207 | 9.1 | 2.3 |
5 | 226 | 9.1 | 2.3 |
6 | 205 | 9.1 | 2.3 |
7 | 261 | 9.2 | 2.4 |
8 | 542 | 9.3 | 2.6 |
9 | 119 | 10.1 | 2.9 |
10 | 97 | 10.5 | 3.0 |
USING THE HRF INDEX
Looking at the total runs trend a little deeper, we have data on how often certain Index levels beat the odds for total runs. Games that have held a 9 or 10 Index for the entire game are scored more than 8.5 runs 68.5% of the time, and more than 9.5 runs 55.5% of the time. Games with a 1 or 2 Index come in with under 10.5 total runs 68.9% of the time and less than 9.5 in 64.9% of games AND less than 8.5 runs 57.9% of the time. When the index is 1 or 2, runs are on average well below typical average games.
Results will vary, and these numbers are averaged over EVERY game in the ENTIRE season.
Check back here to see a statistics for 2024 once the season is under way. We will post updates a few times during the season here and regularly on our Twitter/X account.
You can still view our 2022 results if you Click Here.
DISCLAIMER
The Home Run Forecast (HRF) Index values provided on the “homerunforecast.com” web site are based on engineering and meteorological judgement and are to be used for informational purposes only. The HRF Index is not a predictor of the number of total runs or home runs in any given game. The HRF Index is one of many factors to be considered in any evaluation of “Over/Under” set values. Past performance of the HRF Index versus the number total runs or home runs is no guarantee of future results. The accuracy of any weather forecast and other meteorological data provided on this web site cannot be guaranteed and are provided for informational purposes only. The authors of this web site do not condone sports betting in any manner which involves a serious amount of risk. The “homerunforecast.com” web site and its publishers are not liable for any sports betting decisions made by its viewers or subscribers. If you or someone you know has a gambling problem, please seek professional help.